
Landing Page Conversion Rates: Benchmarks & Statistics
A study of 9 million visits across 867 pages + Free comparison tool
 Andrew Fennell | Last updated 15 October 2026
What’s a good conversion rate for your landing page?
We analysed 8,964,987 visits across 867 landing pages to compare average and typical conversion rates by industry, page type, traffic source and conversion goal.
We also examined 23 page elements from videos to testimonials to see what the best-performing pages had in common.
Use the results to benchmark your page against similar ones, find improvements worth testing and calculate what a higher conversion rate could mean for your revenue.
Key landing page conversion rate statistics
The average landing page conversion rate is:
of top-performing landing pages have a CTA above the fold.
Enquiry pages with no pricing have a 21% lower conversion rate.
Sales pages with case studies have double the typical conversion rate.

Scarcity/Urgency messaging does not increase conversions
Enquiry pages featuring video have a 23% higher conversion rate.
Resources & free tools have the highest average conversion rate at 8.58%
Organic traffic drives double the amount of conversion than social.
What is the average landing page conversion rate?
The average landing page conversion rate in our sample was 5.25%, while the typical rate was 3.43%.
The average (mean) adds up each page’s conversion rate and divides by the number of pages. A few exceptionally high rates can pull it upwards.
The typical rate (median) is the middle result: half the pages converted below it and half above it.
Think of five pages converting at 1%, 2%, 3%, 4% and 20%. Their average is 6%, but their typical rate is 3%.
Use the typical rate as a starting benchmark, then compare pages with the same conversion goal as yours.
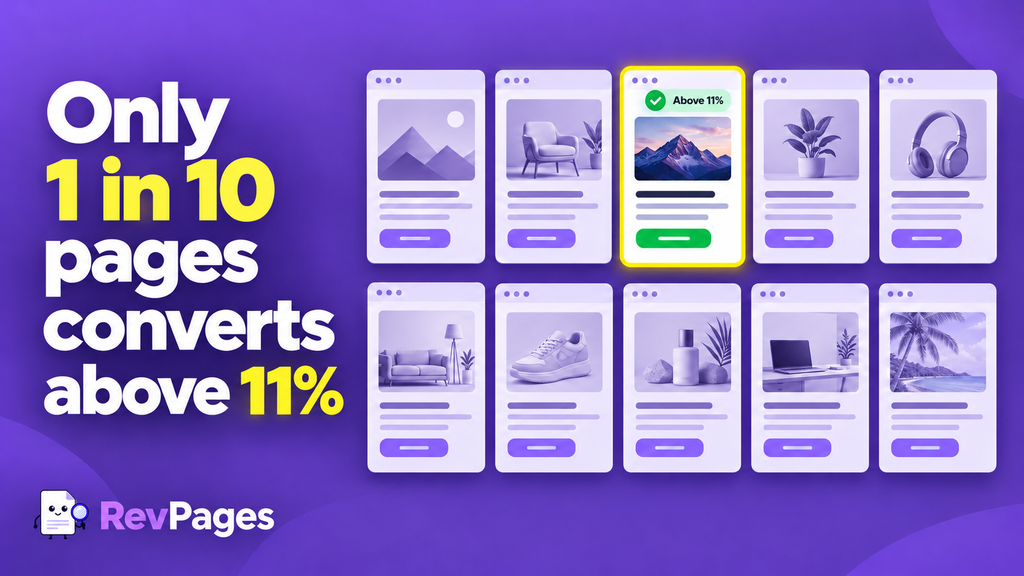
Is your landing page conversion rate good?
Use our free benchmarking tool to compare your landing page against similar businesses and page goals
What is a good landing page conversion rate?
A good conversion rate is one that puts you ahead of comparable pages, and generates enough value to make your marketing worthwhile.
The typical rate in our sample was 3.43%, but it varies greatly depending on factors like industry, page-type and conversion goals.
For example, purchase pages typically convert at 2.00%, compared with 7.58% for resource downloads.
So a 4% conversion rate could be strong for a purchase page but below the benchmark for a free download.
Use our landing page benchmark tool above to see how your page compares to similar pages.
Enter your conversion goal, industry, page type and current results to find the most relevant benchmarks and explore what elements might improve its success.
What does a higher conversion rate mean for your business?
A higher conversion rate means getting more customers from the traffic you already have.
For example, a purchase page receiving 5,000 visits a month at a 2% conversion rate generates 100 sales. Increase that rate to 3% and you get 150 sales. At an average sale value of £100, that’s £5,000 more monthly revenue.
Use the calculator below to enter your current conversion rate, monthly traffic, average sale value and lead conversion rate, to see how much a higher conversion rate could be worth.
What factors affect landing page conversion rates?
Your conversion rate depends on what you offer, who visits your page and what the intent behind each visit is.
Landing page conversion rates by industry
Buying decisions differ across industries. Use these benchmarks to compare your page with businesses in your sector, while keeping your conversion goal in mind.
| Industry | Average conversion rate (mean) | Typical conversion rate (median) |
|---|---|---|
| 🚗 Automotive & transport | 5.67% | 4.02% |
| 🛍️ Ecommerce & retail | 3.83% | 2.46% |
| 🎓 Education & training | 5.67% | 3.53% |
| 🏦 Financial services & insurance | 5.55% | 3.86% |
| 🧘 Fitness, wellness & beauty | 4.58% | 4.01% |
| 🩺 Healthcare | 5.50% | 3.78% |
| 🛠️ Home improvement & local trades | 6.60% | 4.04% |
| ⚖️ Legal services | 6.42% | 4.89% |
| 🏭 Manufacturing & industrial | 5.48% | 3.18% |
| 🎨 Marketing & creative services | 6.16% | 3.56% |
| 🎬 Media, entertainment & events | 4.63% | 4.12% |
| 💼 Professional & business services | 5.05% | 3.51% |
| 🏠 Property & real estate | 5.59% | 3.13% |
| 💻 Software & SaaS | 5.42% | 3.56% |
| ✈️ Travel & hospitality | 3.78% | 2.71% |
B2B vs B2C landing page conversion rates
Business and consumer audiences have different needs and buying processes. This table compares conversion rates across B2B and B2C pages.
| B2B or B2C | Average conversion rate (mean) | Typical conversion rate (median) |
|---|---|---|
| 💼 B2B | 5.66% | 3.73% |
| 🛒 B2C | 4.82% | 3.18% |
Landing page conversion rates by goal
A purchase requires more commitment than a free download. Your conversion goal is a useful starting point for finding a relevant benchmark.
| Goal | Average conversion rate (mean) | Typical conversion rate (median) |
|---|---|---|
| 🛒 Purchase or paid subscription | 2.79% | 2.00% |
| ⏳ Free trial registration | 4.41% | 4.38% |
| 👤 Free account registration | 7.26% | 4.78% |
| 🖥️ Demo request | 4.07% | 2.65% |
| 💬 Enquiry or quote request | 4.50% | 2.90% |
| 📅 Appointment or consultation booking | 5.07% | 3.65% |
| 📥 Resource download or access | 10.98% | 7.58% |
| ✉️ Newsletter or mailing-list subscription | 3.57% | 3.20% |
| 🎟️ Event or webinar registration | 8.45% | 6.35% |
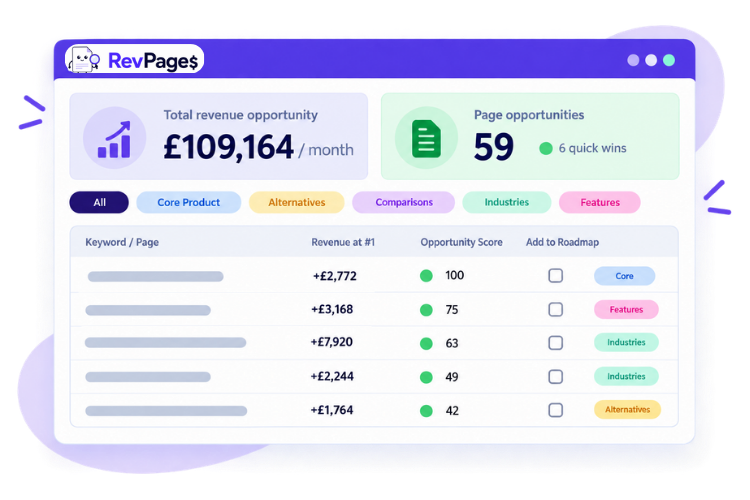
Find your most profitable landing pages in 90 seconds
Revenue forecasted. Instantly prioritised by revenue-potential and ranking achievability.
Landing page conversion rates by page type
Product pages, pricing pages and free tools serve different purposes. This breakdown shows how conversion rates vary across page types.
| Page type | Brief description | Average conversion rate (mean) | Typical conversion rate (median) |
|---|---|---|---|
| 📦 Physical product purchase | Promotes a physical product for customers to buy. | 3.02% | 2.06% |
| 💻 Software product purchase | Promotes software for a paid purchase or subscription. | 2.25% | 2.29% |
| 💼 B2B service enquiry | Promotes a service aimed at businesses. | 5.26% | 4.06% |
| 🧑 B2C service enquiry | Promotes a service aimed at individual consumers. | 4.04% | 3.03% |
| 🔄 Alternatives | Presents substitutes for a particular product or provider. | 3.06% | 1.59% |
| 🏆 Best-of or category roundup | Lists recommended options within a product or service category. | 4.18% | 2.67% |
| ⚖️ Comparison | Compares two or more products, services or providers. | 4.57% | 3.13% |
| 🎟️ Event or webinar | Promotes an event and invites visitors to register. | 8.45% | 6.35% |
| ⚙️ Feature or use case | Explains a specific capability or problem the offer solves. | 5.06% | 3.67% |
| 🎯 Industry or audience | Tailors the offer to a particular sector or customer group. | 4.17% | 2.65% |
| 📍 Location | Promotes products or services available in a specific area. | 5.43% | 3.79% |
| 💳 Pricing or packages | Sets out prices, plans or service packages. | 5.05% | 3.47% |
| 🛠️ Resource or free tool | Offers a useful resource, template, calculator or free tool. | 8.58% | 5.57% |
Landing page conversion rates by traffic source
Where visitors come from can influence their readiness to act. This table compares pages grouped by their main traffic source.
| Traffic source | Average conversion rate (mean) | Typical conversion rate (median) |
|---|---|---|
| 🌱 Organic | 5.71% | 3.97% |
| 💬 Social | 3.45% | 2.01% |
| 🔍 Paid search | 6.58% | 4.35% |
| 📣 Paid social | 4.08% | 2.97% |
| 6.53% | 4.68% | |
| 🖼️ Display ads | 2.52% | 1.90% |
Landing page conversion rates by device type
Screen size and ease of use can shape the visitor experience. This table compares pages grouped by their predominant device.
| Device | Average conversion rate (mean) | Typical conversion rate (median) |
|---|---|---|
| 🖥️ Desktop | 6.32% | 4.22% |
| 📱 Mobile | 4.38% | 2.97% |
| 📲 Tablet | 3.90% | 2.89% |
Which landing page elements affect conversions?
Beyond fixed variables such as your industry and conversion goal, the content and layout of your landing page will also influence performance.

Your headline, benefits and features help visitors understand what you offer and why it matters to them.
Button wording, placement and navigation shape how easily visitors find and complete the main action.

Testimonials, reviews, case studies and guarantees give visitors evidence and reassurance when considering your offer.
Forms determine how much effort it takes to respond, while pricing helps visitors judge whether the offer fits their budget.
Images, video, FAQs, process explanations and chat help visitors understand the offer and resolve questions.
How each landing page element affects conversions
We compared 23 elements across the pages in our sample to see what top performers (the 25% of pages with the highest conversion rates within each conversion goal) had in common and how conversion rates differed between pages with and without each element.
The table below highlights those relationships.
Discover which page elements make the biggest impact
Choose a group to explore how different page elements relate to conversion rates.
Group
| Group | Element | Short description | Key insight |
|---|---|---|---|
| Messaging | Clear value proposition | Headline explains the main benefit or outcome. | Present on 91% of top-performing pages, versus 68% of remaining pages. |
| Messaging | Benefits section | Explains what the customer gains. | Enquiry pages with a benefits section had more than double the typical conversion rate. |
| Messaging | Features or deliverables | Explains what the offer includes. | Enquiry pages listing features or deliverables had an 18% higher typical conversion rate. |
| CTAs and navigation | Primary CTA above the fold | Main conversion action is visible without scrolling. | 93% of top-performing pages had an above-the-fold CTA. |
| CTAs and navigation | Repeated CTA | Primary action appears again further down the page. | Enquiry pages with repeated CTAs had a 41% higher typical conversion rate. |
| CTAs and navigation | Sticky CTA | Conversion button stays visible while scrolling. | Enquiry pages with sticky CTAs had a 42% higher typical conversion rate. |
| CTAs and navigation | CTA wording | Specific action wording versus generic labels. | Enquiry pages with specific wording had a 70% higher typical conversion rate than those with generic wording. |
| CTAs and navigation | Competing actions | Prominent CTAs lead to different goals. | Enquiry pages with competing actions had a 29% lower typical conversion rate. |
| CTAs and navigation | Main navigation | Full, reduced or no navigation menu. | Reduced navigation appeared on 31% of top performers, versus 25% of remaining pages. |
| Trust and reassurance | Customer testimonials | Written recommendations from customers. | Testimonials appeared on 83% of top performers, versus 55% of remaining pages. |
| Trust and reassurance | Ratings and reviews | Star ratings, review scores or review widgets. | Enquiry pages with ratings and reviews had a 6% higher typical conversion rate. |
| Trust and reassurance | Customer or client logos | Logos identifying existing customers. | Enquiry pages with customer logos had a 45% higher typical conversion rate. |
| Trust and reassurance | Case studies or results | Examples of customer outcomes. | Case studies were 2.15 times as common on top-performing pages. |
| Trust and reassurance | Trust badges or credentials | Relevant certifications, awards or assurances. | Enquiry pages with trust badges had a 24% higher typical conversion rate. |
| Trust and reassurance | Guarantee or risk reduction | Guarantee, trial or cancellation reassurance. | Enquiry pages with risk reassurance had a 34% higher typical conversion rate. |
| Forms and pricing | Form on the page | Visitors can complete the primary form without leaving. | Enquiry pages with an embedded form had a 13% higher typical conversion rate. |
| Forms and pricing | Pricing displayed | Exact price, starting price, range or no price. | Enquiry pages showing pricing had a 27% higher typical conversion rate than those showing none. |
| Supporting content and assistance | Product or service imagery | Images showing the actual offer. | Imagery was similarly common on top performers and remaining pages: 84% versus 81%. |
| Supporting content and assistance | Video | Demo, explainer, testimonial or another video. | Enquiry pages featuring video had a 23% higher typical conversion rate. |
| Supporting content and assistance | Process explanation | Explains purchase, delivery or onboarding steps. | Enquiry pages explaining the process had a 24% higher typical conversion rate. |
| Supporting content and assistance | FAQ section | Answers common questions and objections. | Enquiry pages with FAQs had a 76% higher typical conversion rate. |
| Supporting content and assistance | Urgency or scarcity | Deadlines, limited availability or time-limited offers. | Enquiry pages using urgency had a 5% lower typical conversion rate. |
| Supporting content and assistance | Live chat | Human chat or chatbot available on the page. | Enquiry pages with live chat had a 12% lower typical conversion rate. |
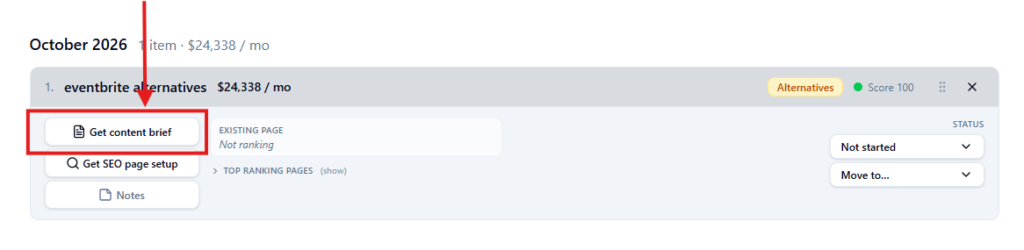
RevPages helps you to add more conversion driving features to your landing pages with AI generated content briefs for every revenue-driving page it discovers for you.
Methodology
How we carried out the study
We analysed 867 landing pages covering 8,964,987 visits from 169 businesses, using analytics data collected over a 4 month period.
Each page had one primary conversion goal. We calculated its conversion rate by dividing visits that completed that goal by total landing-page visits, counting each visit as converted only once. Duplicate records and pages with unreliable tracking were excluded; pages with zero conversions were retained.
We grouped pages by industry, B2B or B2C audience, page type, conversion goal, predominant traffic source and device. We report both the average (mean) and typical rate (median), giving each page equal weight.
We also recorded 23 page elements using consistent definitions, then compared their presence and performance. “Top performers” were the highest-converting quarter within each conversion goal, keeping purchases separate from actions such as free downloads.
These comparisons show associations, not proven effects. Differences in offers, brands and visitors may help explain the results, so use the findings as benchmarks and ideas to test.
How we built the calculators
The benchmarking tool uses a regression model to learn patterns from the 867-page dataset. It estimates a conversion rate based on your page’s industry, audience, goal and other characteristics, then compares it with your own rate.
The impact calculator compares scenarios with different page elements included or removed. It shows how the model’s estimate changes, rather than promising what will happen after you make an edit.
More useful tools: SaaS SEO ROI calculator | SEO Proposal Template
What to keep in mind
These benchmarks offer a useful reference, and whilst we studied lots of pages – we certainly haven’t covered the entire internet’s landing page activity. There will always be extremes, fringe cases and reasons why pages perform much better or worse than calculated averages.
FAQs
- Key landing page conversion rate statistics
- What is the average landing page conversion rate?
- Is your landing page conversion rate good?
- What is a good landing page conversion rate?
- What does a higher conversion rate mean for your business?
- What factors affect landing page conversion rates?
- Which landing page elements affect conversions?
- How each landing page element affects conversions
- Methodology
- FAQs